Technical SEO

How to Monitor Core Web Vitals in Search Console

Open the Search Console Core Web Vitals report, read real-user field data for LCP, INP and CLS, then use PageSpeed Insights or Lighthouse to debug failing URL groups.

FindSEO5 min read

A wooden-framed hourglass with dark sand collected in the lower chamber, standing on a pale surface in soft light.

Photo: Suohros / Wikimedia Commons (CC0)

In this article
  1. What are you measuring?
  2. How do you open the Search Console report?
  3. How do you use lab tools without mixing them up?
  4. A Core Web Vitals monitoring checklist
  5. The bottom line

To monitor Core Web Vitals, verify your site in Google Search Console and open the Core Web Vitals report. The report uses real-user field data, grouped as Poor, Needs improvement or Good, for Largest Contentful Paint (LCP), Interaction to Next Paint (INP) and Cumulative Layout Shift (CLS). Drill into mobile and desktop, fix the URL groups that fail, and use PageSpeed Insights or Lighthouse when you need a lab test of a single URL.

This is about watching the official field data over time, not about chasing a one-off Lighthouse score. Our earlier article explains whether Core Web Vitals affect rankings. This guide covers how to set up the monitoring itself, using Google's report documentation and web.dev's Core Web Vitals overview.

What are you measuring?

Google's current Core Web Vitals, described on web.dev, are:

  • LCP (Largest Contentful Paint): when the main content appears. The good threshold is 2.5 seconds or less at the 75th percentile.
  • INP (Interaction to Next Paint): how quickly the page responds to clicks, taps and key presses. The good threshold is 200 milliseconds or less at the 75th percentile. INP replaced First Input Delay in March 2024.
  • CLS (Cumulative Layout Shift): how much the layout unexpectedly moves. The good threshold is 0.1 or less at the 75th percentile.

Those thresholds are official targets, not invented house rules. A page can pass two metrics and still be Poor overall, because Search Console uses the worst of the metrics it can report.

Several hourglasses of different sizes standing together, with sand visible in their glass chambers.
Judge pages by real-user field data at the 75th percentile, not by a single lab score. Photo: Aaaatu, CC BY-SA 4.0, via Wikimedia Commons.

How do you open the Search Console report?

  1. Set up Search Console and verify the property if you have not already.
  2. Open the Core Web Vitals report from the Experience or later equivalent menu. Google's Core Web Vitals report help is the official manual for this screen.
  3. On the overview, look at the charts for Mobile and Desktop separately. Click Open report next to a chart to drill in.
  4. Toggle Poor, Need improvement and Good on the performance chart.
  5. Use the table of issues to see URL groups that are not Good. Each example URL stands for a group of similar pages, such as a template.
  6. Open an example to see the failing metric, then follow the links to test a specific URL.

The report is based on the Chrome User Experience Report (CrUX) field data from real Chrome users, not on a simulated test. Google says it is not a complete list of every indexed URL, only a sample with enough data. Only indexed URLs can appear. Data is assigned to the actual URL, not the canonical URL, which is different from most other Search Console reports.

If you see "No data available", the property may be new, or there may not yet be enough CrUX data for that device type. Google says it can take a few days after you create a property for existing CrUX data to be analysed and posted. Small or new sites often have this gap. You can still test individual URLs with PageSpeed Insights or Chrome Lighthouse.
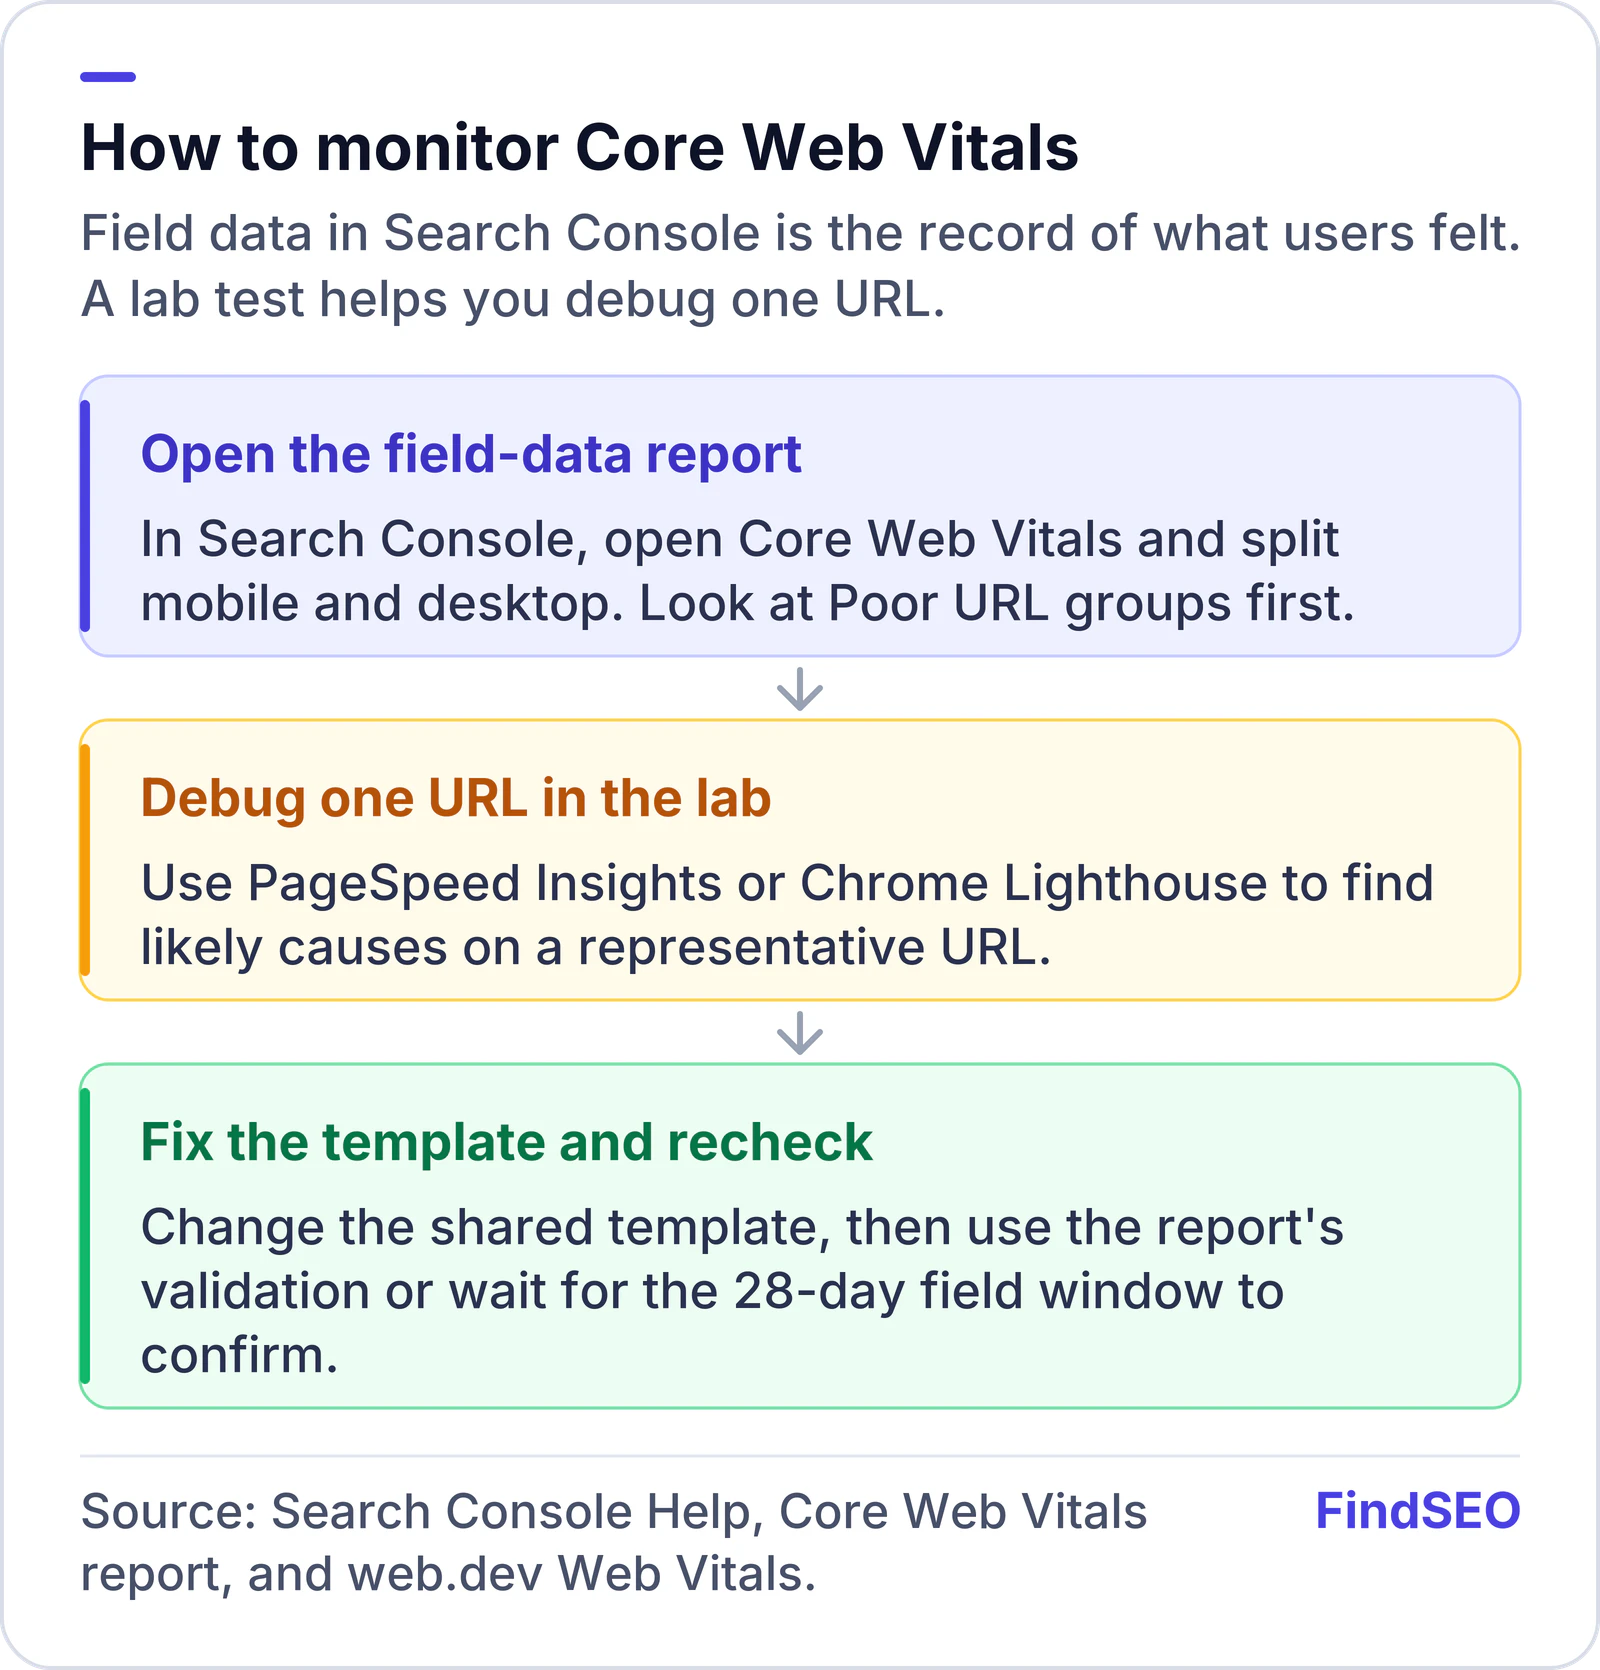
How to monitor Core Web Vitals: open the Search Console report for field data, split mobile and desktop, inspect Poor URL groups, then use PageSpeed Insights or Lighthouse for a lab test of a single URL, fix the template, and use the report's validation to confirm the issue clears in real-user data.
Field data in Search Console tells you what users felt. A lab test helps you debug one URL.

How do you use lab tools without mixing them up?

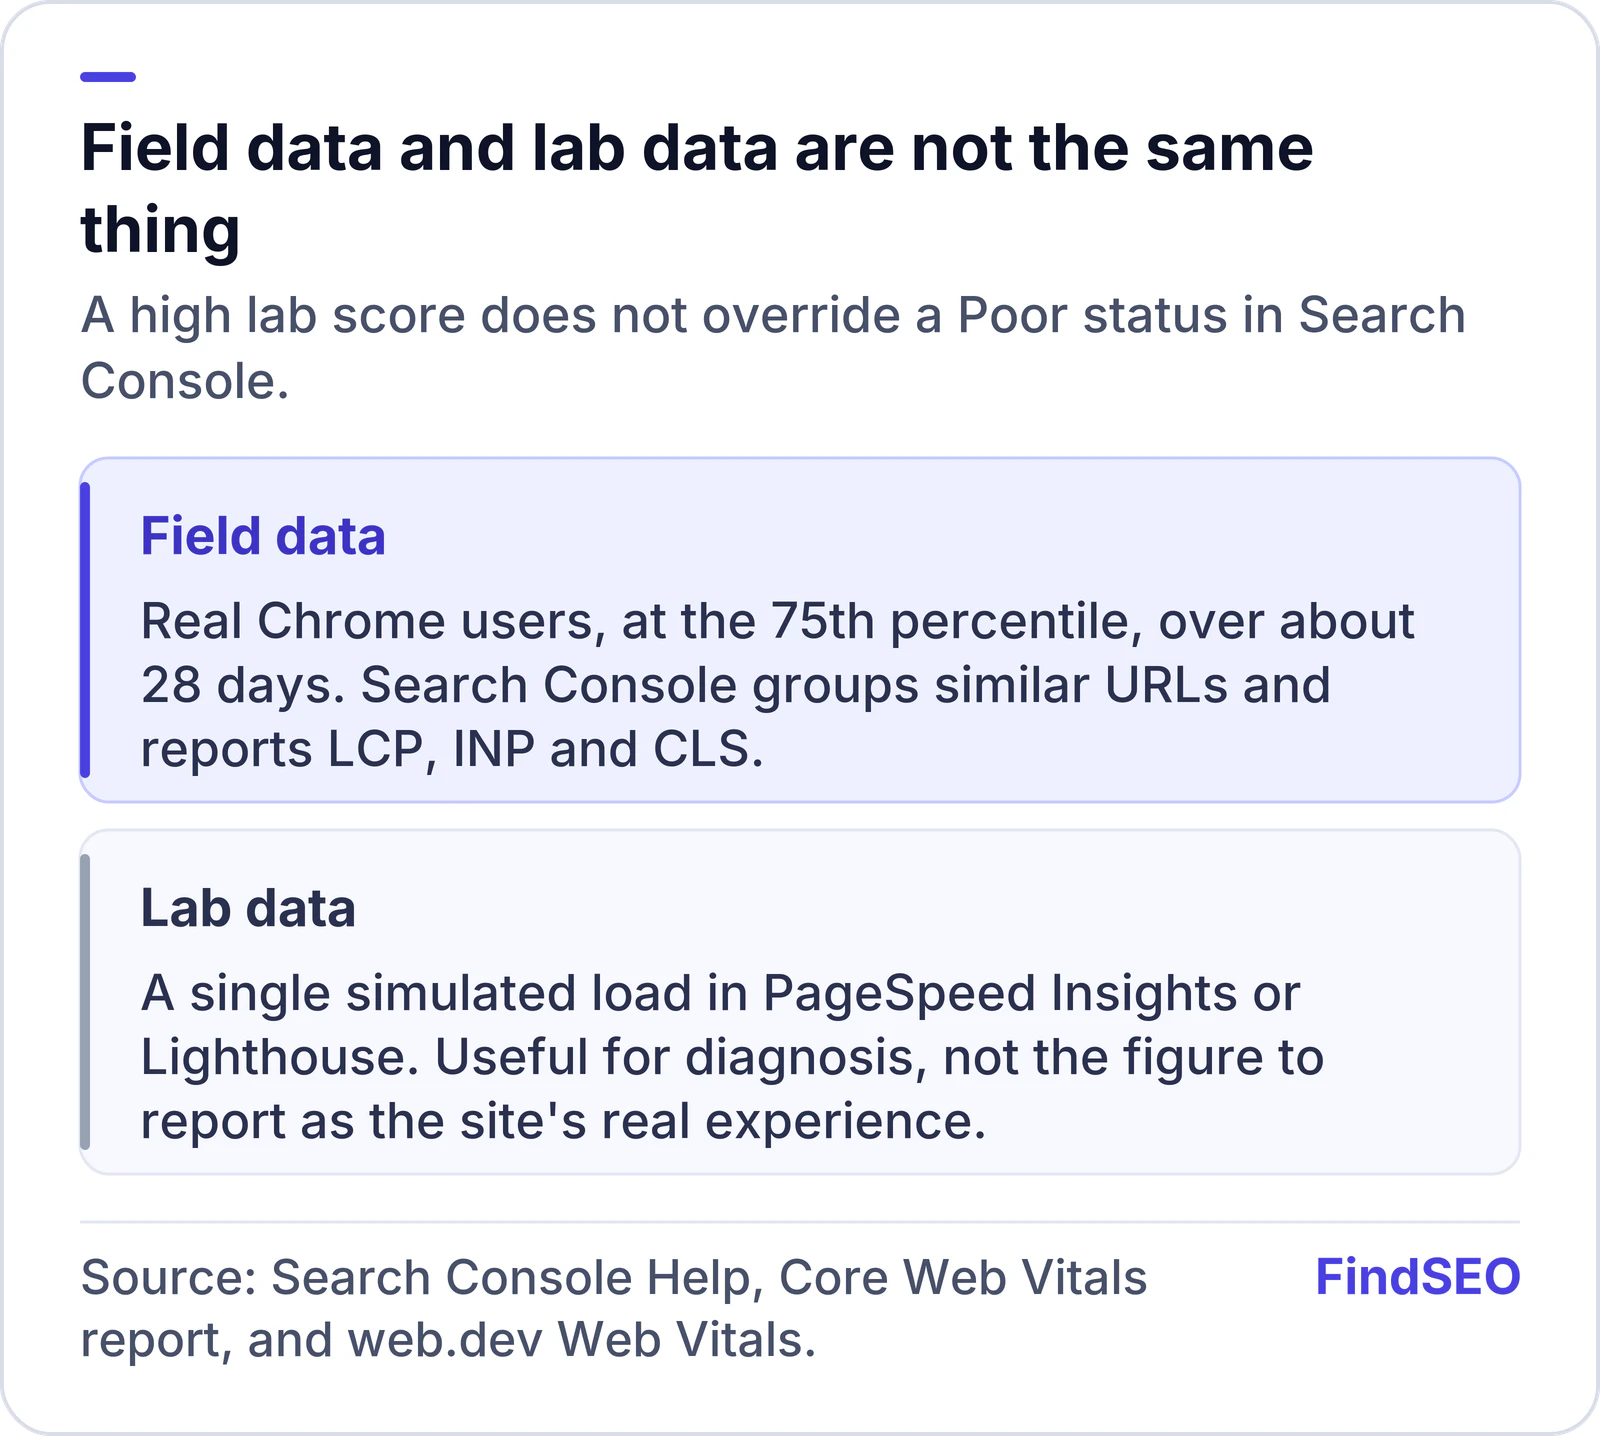
The Search Console report links out to PageSpeed Insights for ordinary pages. That tool shows both field data (when it exists) and a lab test with suggestions. Google's help page notes that PageSpeed Insights figures can differ from the Search Console report, because Search Console groups similar URLs and uses 28 days of real-user data, while a lab test is a single simulated load.

Field data from real Chrome users over about 28 days is what Search Console reports for LCP, INP and CLS. Lab data from PageSpeed Insights or Lighthouse is a single simulated load, useful for diagnosis but not a replacement for the field report.
Report field data from Search Console. Use a lab test to find likely causes on one URL.

Use the tools this way:

  • Search Console to see which templates fail in the real world, on mobile and desktop, over the last 28 days.
  • PageSpeed Insights to inspect one URL, read the field section when it is present, and use the lab section to find likely causes.
  • Chrome Lighthouse in the browser for a repeatable lab test while you work on a fix.

When you change a template, give the field data time to move. Google documents a validation flow in the same report: after you fix an issue you can start validation, and URLs move through Pending, Passed or Failed as enough new field data arrives. URLs with no data in the last 28 days drop out of the report.

For many sites, the first wins are template-level: images that are too heavy (see our image SEO guide), layout shifts from ads or embeds without reserved space, and slow server or script time that delays LCP. A technical SEO audit should already flag these.

You do not need a separate Analytics property to start this monitoring, but GA4 is still useful for seeing whether slow pages also lose engagement.

Woodworking hand tools, including a measuring tape, a square and a plane, laid out on pale timber planks.
Fix issues at template level, then wait for 28-day field data, or use the report's validation, to confirm the change. Photo: A S M Jobaer, CC BY-SA 4.0, via Wikimedia Commons.

The thresholds themselves are documented on the metric pages for LCP, INP and CLS. Google also explains how page experience fits into Search in its page experience documentation. Use those pages when you need the precise definition of a metric, and use the Search Console report when you need to know which of your templates fail in the field.

Google's report help adds two more practical points. First, traffic from countries with slower connections will pull the combined figures down; if you suspect that, it says you can break performance down by country in BigQuery. Second, a URL that has been removed and has no field data in the last 28 days disappears from the report and from validation history. That is expected, not a sign that the fix failed.

When you write this up for a client or a board, report the Search Console status of important URL groups, not a single lab score from one test machine. The lab is for diagnosis. The field report is the record.

Start with the URL groups that have both a Poor status and meaningful traffic, rather than trying to perfect every long-tail template. A product or service template that fails INP or LCP for thousands of sessions is worth more than a barely visited archive page with a slightly high CLS. Re-check the report on a schedule, such as after a design release or a major image change, because a new template can move a whole group from Good to Poor at once.

A Core Web Vitals monitoring checklist

  • The site is verified in Search Console, and you have opened the Core Web Vitals report for both mobile and desktop.
  • You know which URL groups are Poor or Need improvement, and which metric fails.
  • You are judging success on field data, not only on a Lighthouse score.
  • INP is the responsiveness metric you watch, not FID.
  • Fixes are made on the shared template, then retested in PageSpeed Insights or Lighthouse.
  • You use the report's validation, or wait for the 28-day window, before calling an issue resolved.
  • Image weight, layout shifts and obvious redirect chains on important URLs have been checked.

The bottom line

Core Web Vitals monitoring starts with the official field-data report in Search Console. Split mobile and desktop, fix Poor URL groups at template level, and use PageSpeed Insights or Lighthouse as a diagnostic, not as the score you report to clients. Field data moves over weeks, not hours. For help with the work itself, compare technical SEO services or get matched with an agency.

FAQs

Where is the official Core Web Vitals report?

In Google Search Console. Google's Core Web Vitals report help explains that it uses real-user field data, grouped by status, metric and URL group, for mobile and desktop. You need a verified property, and enough Chrome User Experience Report data, before rows appear.

What are good Core Web Vitals scores?

Google's targets, measured at the 75th percentile of real page loads, are Largest Contentful Paint in 2.5 seconds or less, Interaction to Next Paint in 200 milliseconds or less, and Cumulative Layout Shift of 0.1 or less.

Why does Search Console say Poor when PageSpeed Insights looks fine?

Search Console uses field data from real Chrome users over about 28 days, grouped by similar URLs. PageSpeed Insights also offers a lab test of a single load, which can differ. Google's report help notes that the two tools can disagree, and that you should treat field data as the record of what users experienced.

Why is there no data in the Core Web Vitals report?

Google says this happens when the property is new or when there is not enough CrUX data for that device type. Only indexed URLs with enough real-user data appear. You can still test individual URLs in PageSpeed Insights or Lighthouse.

Is First Input Delay still a Core Web Vital?

No. Interaction to Next Paint replaced First Input Delay in March 2024. The Search Console report now uses INP, LCP and CLS.

Sources

Ready for help with SEO?

Compare SEO-only agencies near you, with client reviews checked by a person, or tell us what you need and get matched.